If you run a premium DTC brand in the US, you already know that not all ZIP codes are equal.
But how unequal? And where, specifically, do the customers live?
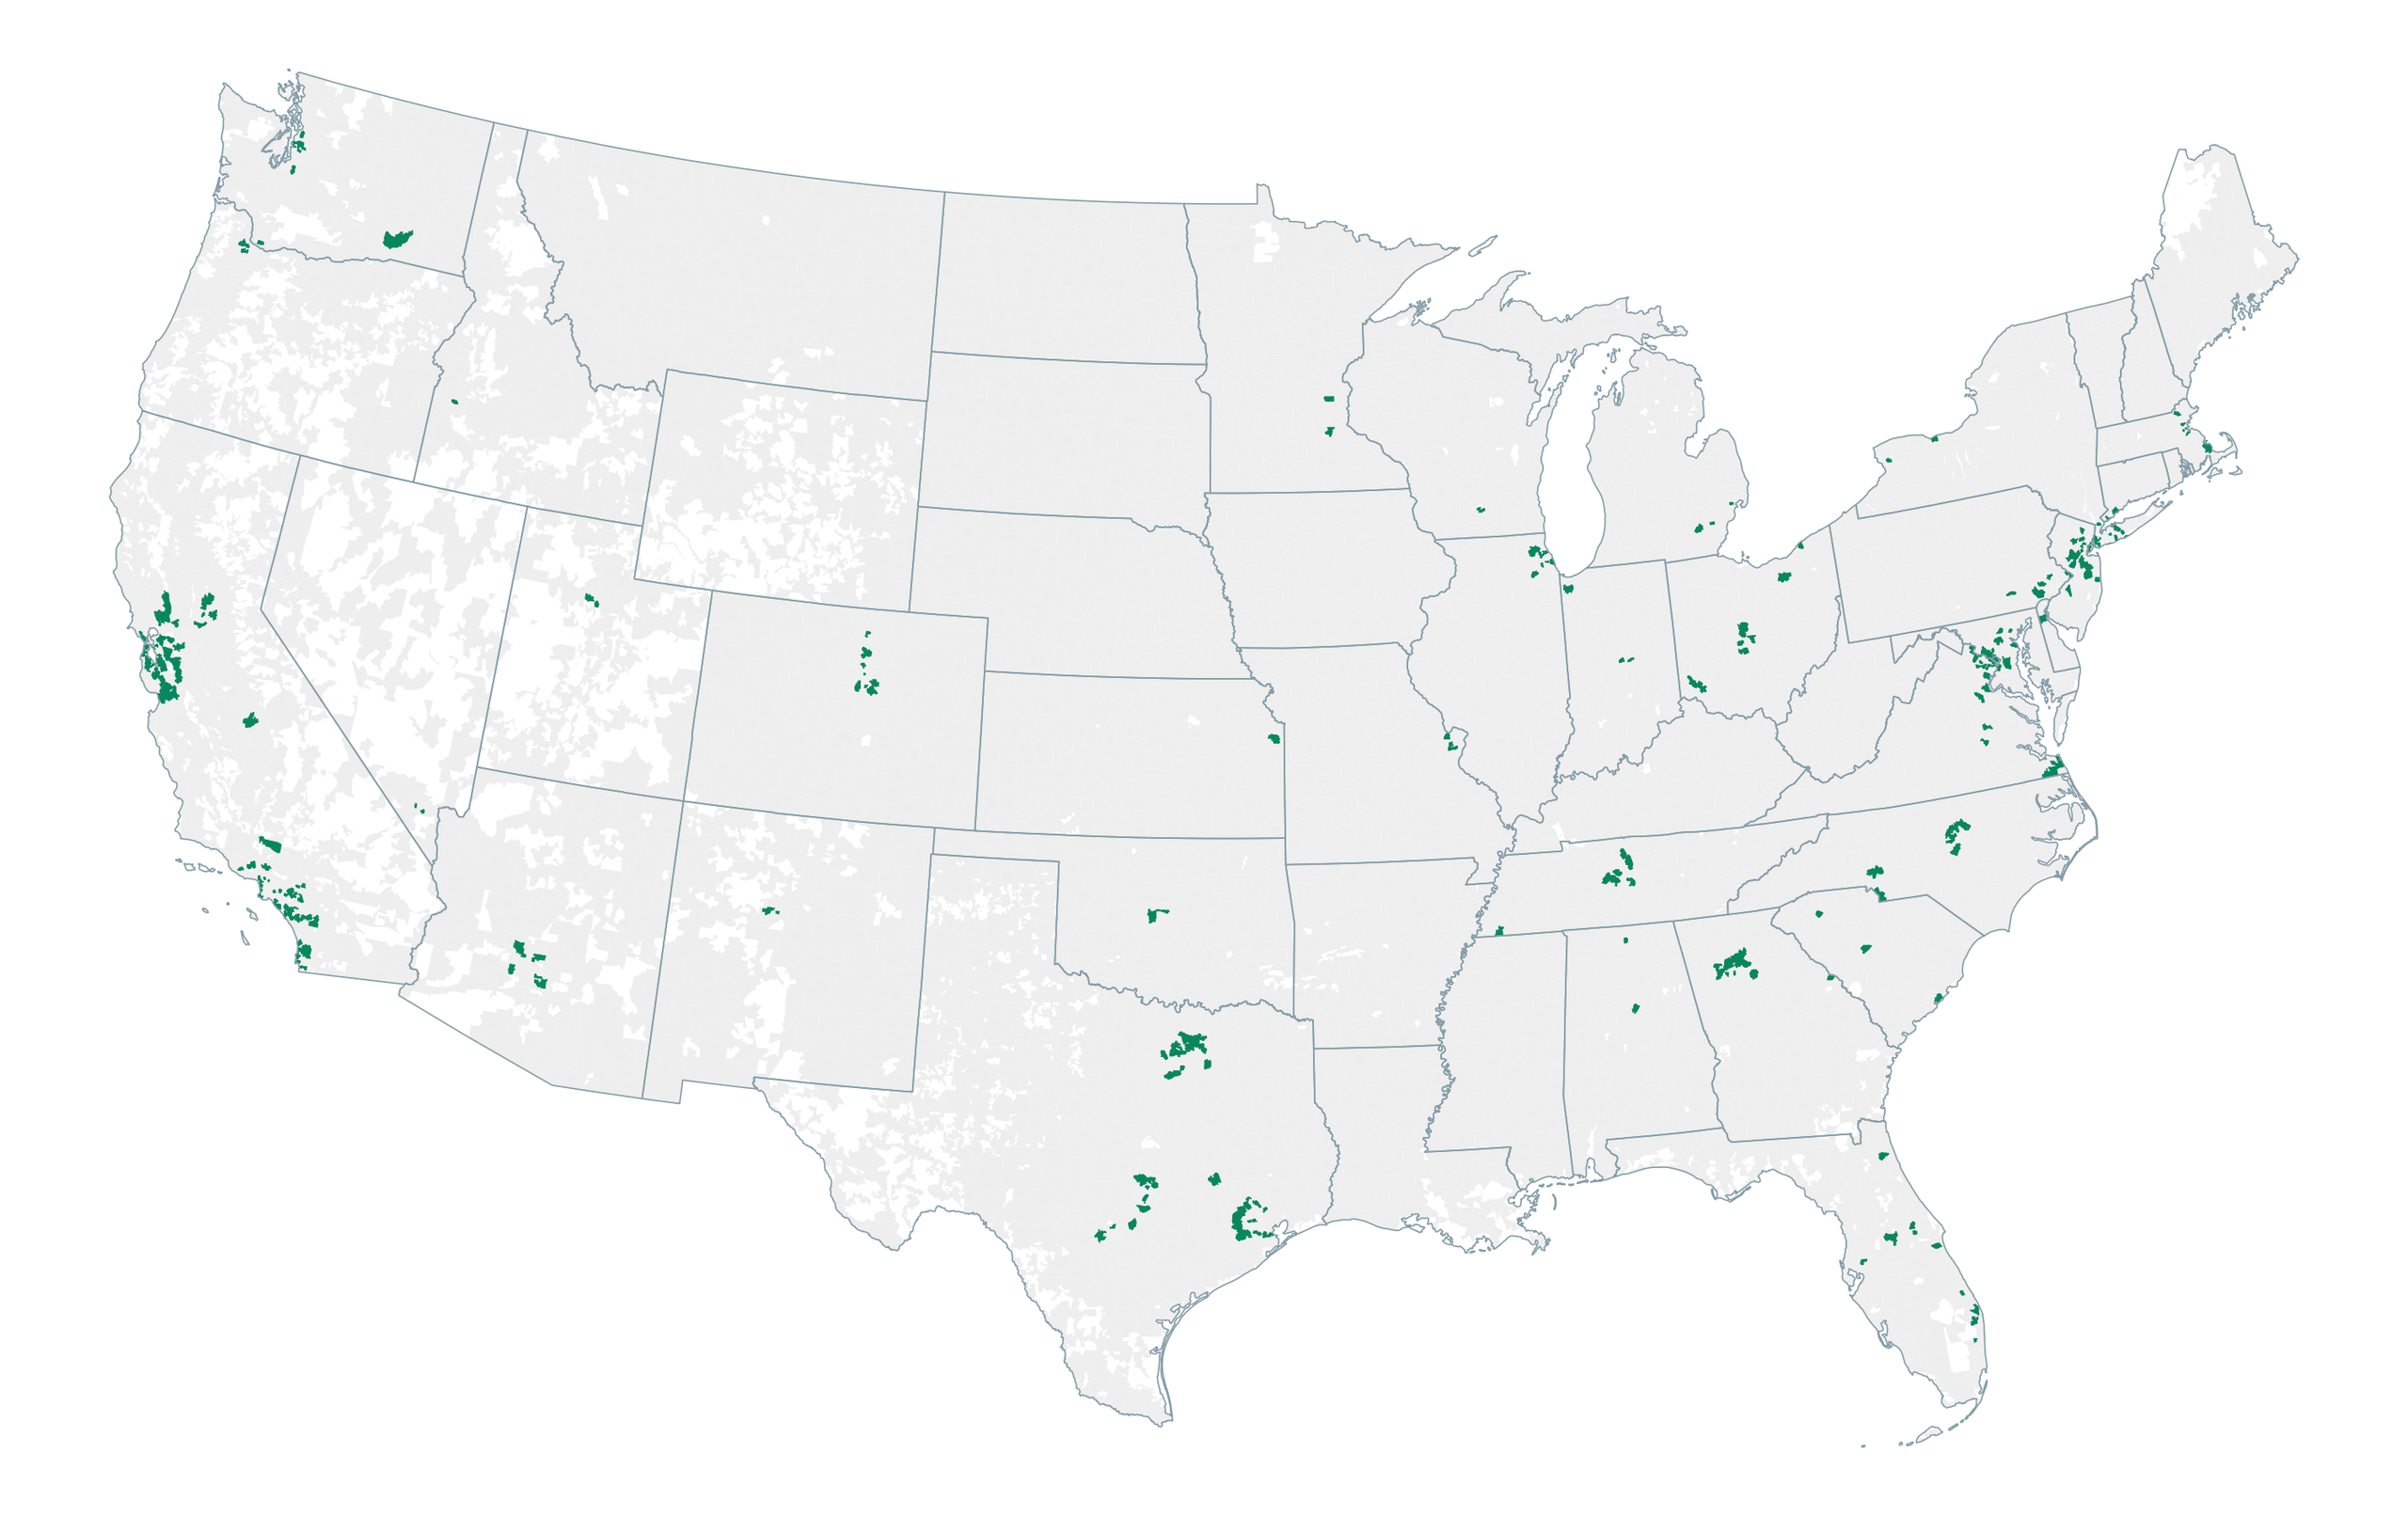
I pulled Census data on all 33,791 US ZIP codes, ranked them by ZIP Target Score, and mapped the top 500. That’s about 1.5% of America’s ZIP codes.
ZIP Target Score = median income of ZIP X Household density of the ZIP Those 500 ZIPs represent over $1.4 trillion in household income annually — roughly the size of Spain’s economy — packed into a fraction of a percent of the country’s land area.
The map looks like this:
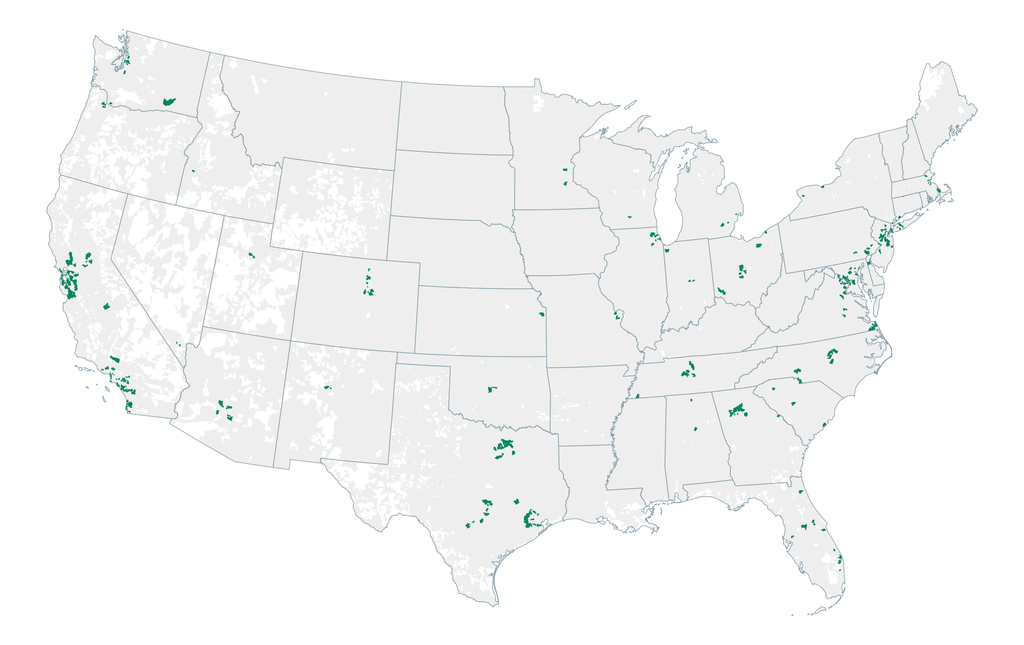
At first glance, it confirms what everyone expects: the coasts light up, some clusters in Texas and the Midwest, a lot of empty in the middle.
Look closer, and the specifics get much more interesting. A few of them completely upend the standard playbook.
Here’s the analysis, and what I’d do with it if I were building a premium DTC brand today.
How the map was built
Before the findings, the method — because the choices matter.
Every US ZIP code (technically ZCTA — ZIP Code Tabulation Area) was scored on a single formula:
Score = median household income × number of households
Why that formula? Because a premium DTC brand cares about both. High income alone doesn’t matter if the ZIP has 800 households. High household count alone doesn’t matter if the median income is $45k. The multiplication captures the ZIPs where money and people concentrate together – a proxy for total addressable premium spending in that ZIP.
I added one filter: median income ≥ $80,000. This screens out high-population, low-income ZIPs that would otherwise dominate a raw score. $80k is roughly 15% above the US median — enough to signal real discretionary spend without being aggressively wealthy.
The data comes from the US Census American Community Survey (5-year estimates, [SWAP IN ACS YEAR FROM YOUR DATA]). It’s the most reliable, most complete source of ZIP-level income and household data in the country, updated annually.
I took the top 500 by score and mapped them. That’s the dataset behind everything below.
Finding 1: America’s #1 ZIP is Katy, Texas – not Manhattan
The single highest-ranked ZIP in the country isn’t 10021 (Upper East Side), 90210 (Beverly Hills), or anywhere in the Bay Area.
It’s 77494 — Katy, Texas.
A Houston suburb. 42,600 households. Median household income of $146,105.
The top of the list isn’t a coastal enclave. It’s a subdivision.
This is worth sitting with. Most premium DTC playbooks — the media plans, the influencer targeting, the retail expansion maps — start with the assumption that the wealth-density leaderboard is coastal. It’s not. The winner is a Houston suburb, and it’s not close: 77494 has more raw scoring power than any single ZIP in Manhattan, San Francisco, or Los Angeles.
The reason is simple. Manhattan ZIPs typically have 20,000–30,000 households at very high incomes. Suburbs like Katy combine strong incomes ($146k) with 40,000+ households in a single ZIP. In the multiplication, the suburbs win.
Finding 2: California is broad. Texas and New York are top-heavy.
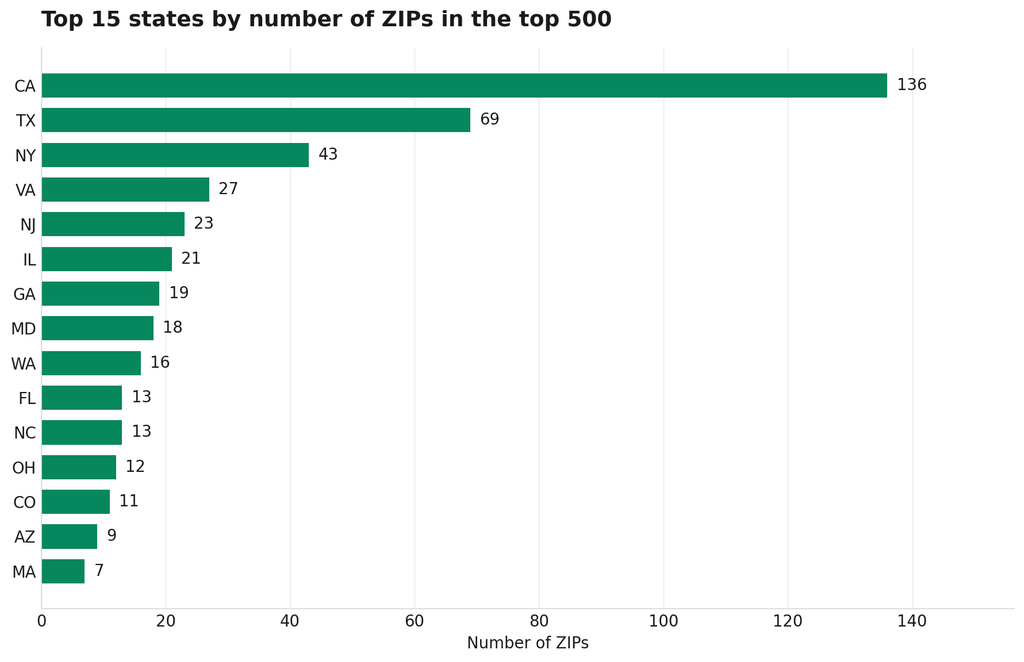
California has 136 ZIPs in the top 500 — 27% of the entire list. It’s the runaway leader by raw count.
But look at the top 20:
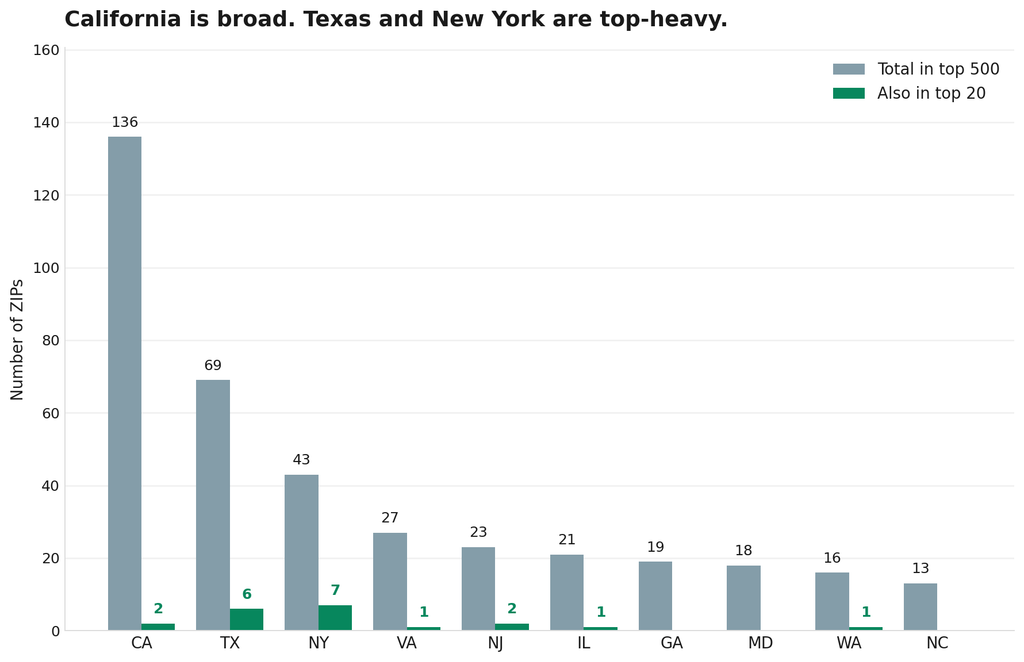
Grouped bar chart comparing total ZIPs in the top 500 vs ZIPs in the top 20 for the top 10 states. California has 136 total but only 2 in the top 20; Texas has 69 total but 6 in the top 20; New York has 43 total but 7 in the top 20
- California: 2 ZIPs in the top 20
- Texas: 6 ZIPs in the top 20
- New York: 7 ZIPs in the top 20
Same list. Completely different concentration curves.
If you’re planning premium DTC media buys, this is the single most important insight in the entire dataset. California gives you volume – lots of solid ZIPs to blanket. Texas and New York give you concentration – a small number of ZIPs where the money is really stacked.
Those are two different playbooks. California favors broad targeting and high-frequency retargeting. Texas and NY reward precision – hit the top 20 hard and hit them often.
Most DTC brands treat all “premium markets” the same. They shouldn’t.
Finding 3: 500 ZIPs, 162 counties, 3 states
The 500 ZIPs sit in only 162 counties. The US has roughly 3,143 counties, so we’re talking about 5% of them holding this list.
Nearly half — 248 of the 500 — are in just three states: California, Texas, and New York.
If you want the shortest possible playbook: CA + TX + NY account for half your addressable premium DTC market. The other 47 states plus DC account for the rest.
That’s not a reason to ignore the other states. But it’s a reason to acknowledge how deeply unbalanced the map is — and to size your investment accordingly.
Finding 4: Names most DTC founders don’t have on their radar
Everyone knows Manhattan and Beverly Hills. Fewer founders know these:
- Katy, TX (#1)
- Sugar Land, TX (#11)
- Ashburn, VA (#12) — data center country, high concentration of tech engineers
- Pflugerville, TX (#14) — the single densest ZIP in the top 500, with 42,673 households
- Cypress, TX (#16)
- Frisco, TX (#17)
- Suwanee, GA (#37) — an Atlanta exurb most brands miss entirely
Each of these outranks the majority of Manhattan ZIPs. Yet ad auctions in these markets are typically less competitive, because the coastal-elite mental model dominates media planning.
If you’re looking for premium DTC growth with better unit economics, these are the ZIPs to test first.
Finding 5: 16 US states have zero ZIPs in the top 500
The absent list:
Alaska, Arkansas, Iowa, Kentucky, Louisiana, Maine, Mississippi, Montana, Nebraska, New Hampshire, North Dakota, Rhode Island, South Dakota, Vermont, West Virginia, Wyoming.
Almost a third of US states don’t produce a single ZIP that clears the premium DTC bar — because they lack the combination of income concentration and household density that the top of the list requires.
This isn’t a judgment on those states. It’s a signal: if you’re a premium DTC brand, national advertising against a national audience is fundamentally an inefficient buy. A third of the country simply isn’t your customer.
Finding 6: The Bay Area has more premium DTC ZIPs than New York City
The SF Bay Area (broadly defined) contains 51 ZIPs from the top 500. All five boroughs of New York City combined: 31.
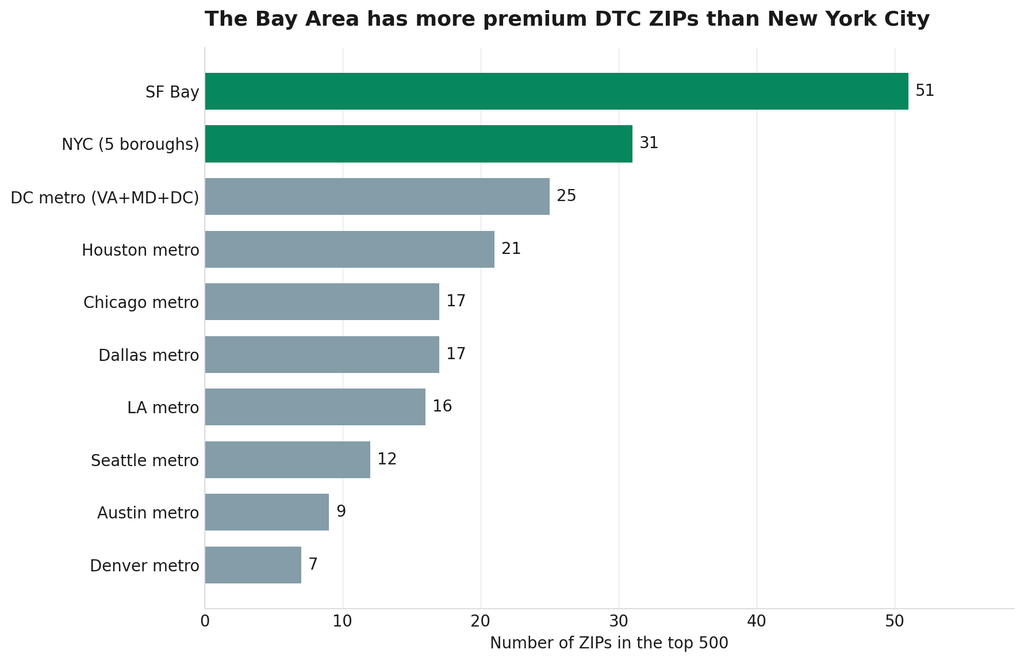
Horizontal bar chart of top US metro clusters by number of ZIPs in the top 500. SF Bay Area leads with 51, followed by NYC 5 boroughs with 31, DC metro with 25, Houston with 21
The Bay Area has 65% more premium DTC ZIPs than NYC — despite a smaller population and a smaller footprint. Tech money is denser than finance money on this map.
The DC metro (VA + MD + DC combined) is the third-largest metro cluster with 25 ZIPs. It rarely shows up on DTC media plans. It should.
Where to grow a premium DTC brand
If you’re deciding where to grow a premium DTC brand in the US, the data gives an unusually clear answer:
1. Start with the top 10 counties. They contain roughly 30% of the top 500 ZIPs. Orange County (CA), Santa Clara County (CA), San Diego County (CA), Cook County (IL), New York County, Kings County (NY), Alameda County (CA), Los Angeles County, King County (WA), San Francisco County. These are the highest-density premium DTC opportunity zones in the country.
2. Test the suburbs of Houston, Dallas, Austin, and DC before you spend more on Manhattan. Ad auctions in Katy, Ashburn, Frisco, and Pflugerville are less competitive per premium impression than in New York or LA. Same customer profile. Better unit economics.
3. Skip the third of the country that doesn’t show up at all. If you’re running national broadcast or national programmatic, you’re paying to reach 16 states of customers who won’t convert.
How to grow a premium DTC brand
1. Geo-target, don’t demo-target. The top 500 ZIPs are more predictable indicators of premium spending than any demographic overlay layered on top of a broad geography. Most ad platforms — Meta, Google, TikTok, programmatic DSPs — let you upload ZIP lists as a custom audience. Use that.
2. Concentrate spend on 100–200 ZIPs, not 3,000. The concentration curve of this dataset means diminishing returns kick in fast. A tight focus on the top 100–200 ZIPs typically outperforms broad targeting, both on CAC and on match quality.
3. Match physical retail expansion to counties, not states. If you’re opening a store or a pop-up, prioritize the 10 counties above. State-level thinking is too coarse — Fort Bend County, TX (six top-500 ZIPs including Katy #1 and Sugar Land #11) is a better single expansion target than most entire states.
The full report
I’m publishing the full ranked list of the 500 ZIPs — with state, county, city, and score for each — as a separate report.
The methodology and code are documented so you can validate the numbers yourself, or extend the framework with additional variables (age distribution, household composition, retail density, competitive presence) that matter for your specific brand.
The map itself will keep updating as the Census releases new ACS vintages. The specific ZIPs will shift year to year. The shape of the concentration curve — a very small number of ZIPs holding most of the premium DTC spending — is unlikely to change.
The country your brand is selling to isn’t 50 states. It’s a few hundred ZIP codes.
Build accordingly.