
The paid demographic-data industry – Experian Mosaic, Claritas PRIZM, Nielsen Segmentation – is worth over $10 billion a year. B2C brands can access similar data from the government’s data source for free.
Most of what these tools sell is one dataset in a nice wrapper: the American Community Survey.
The ACS is the deepest public source of demographic data in the United States, published every year by the US Census Bureau, and available at every ZIP code in the country. Usually, this is the beginning layer for most of the audience tools that power the demographic layer.
Most of the D2C players don’t know its existence, and even if they know about the existence of ACS, they don’t have much idea of how to extract the data and use it for the decision process.
This post is a walkthrough: what the ACS actually contains, how to get demographics for any ZIP code, and five ways B2C founders and marketing/sales operators use it for growth.
What is the American Community Survey?
The American Community Survey (ACS) is an ongoing survey run by the US Census Bureau. It’s been active since 2005, samples roughly 3.5 million US addresses every year, and covers over 40 topics across social, economic, housing, and demographic characteristics.
Response is mandatory under Title 13 of the US Code. That matters more than it sounds: the mandatory-response requirement is why the ACS delivers ~95% response rates while private surveys hover at 5-15%. It’s why the data is treated as gospel by federal agencies distributing over $1.5 trillion in federal funds each year.
The ACS is not the same as the decennial Census. The decennial Census happens every 10 years and counts everyone (short form, ~9 questions). The ACS runs continuously and asks a lot more (~70 detailed questions) of a rotating sample. Think of it this way: the decennial tells you how many people live in a ZIP code; the ACS tells you who they are :- their income, education, occupation, household composition, commute patterns, housing tenure, and dozens more attributes. For B2C operators, the ACS is the useful one. The decennial is a headcount. The ACS is a portrait.
What data does ACS give you at the ZIP-code level?
The ACS publishes data in bundles Census calls “profiles” (DP02-DP05) and hundreds of more granular “subject” and “detailed” tables. At the ZIP-code level (technically ZCTA – more on that in a moment), five categories are useful for B2C decisions:
Income and wealth signals
Median household income, per-capita income, income brackets in $10K buckets, poverty rates, public assistance receipt.
Anchor use case (DTC haircare): A premium haircare brand identifies ZCTAs with median household income above $150K and at least 40% of households earning over $200K. This filters ~33,000 US ZCTAs down to roughly 400 candidates — the addressable premium market.
Age and life stage
Population by 5-year age brackets, median age, sex distribution, foreign-born share.
Anchor use case (specialty coffee): A regional specialty coffee chain finds ZCTAs where 25-40 year-olds make up over 35% of the population — a proxy for the daily-coffee-habit demographic that supports a $6 pour-over.
Household composition
Family vs. non-family households, presence of children under 18, average household size, marital status.
Anchor use case (regional bank): A regional bank promoting a 529 college-savings product filters for ZCTAs with over 40% of households containing children under 18, cross-referenced with median household income above $100K.
Education and occupation
Educational attainment by degree level, field of study, industry of employment, occupation category, class of worker.
Useful for B2B-adjacent DTC (professional apparel, ergonomic products) and financial services product-market fit.
Housing and tenure
Owner vs. renter percentage, median home value, median gross rent, year built, vehicles available per household.
Anchor use case (regional bank): Same bank identifies first-time-homebuyer ZCTAs by filtering for high renter percentage (over 60%), rising median household income year-over-year, and median age between 28-38. The launch list for a targeted mortgage product.
The point isn’t the individual variables — it’s that all of them are available for every ZIP code in America, refreshed annually, at no cost.
ZIP code vs ZCTA – the distinction that trips everyone up
The ACS reports data at ZCTAs (ZIP Code Tabulation Areas), not USPS ZIP codes. They’re not the same thing.
USPS ZIPs are delivery routes — lines and points, not areas. There are roughly 42,000 of them.
ZCTAs are polygons the Census Bureau built to approximate ZIP code areas for statistical purposes. There are about 33,000.
The gap of ~9,000 is mostly PO-box-only ZIPs, business-only ZIPs, and large unpopulated areas that have no residents to survey. In most cases, a USPS ZIP maps cleanly to a ZCTA with the same 5-digit code. When it doesn’t, you need HUD’s USPS-to-ZCTA crosswalk file to reconcile them (covered in the pillar post as dataset #8).
Operational impact: if you naively join Shopify orders (USPS ZIPs) to ACS data (ZCTAs) without the crosswalk, you’ll lose or misallocate roughly 20% of your customer records. Use the crosswalk.
ACS 1-year vs 5-year estimates – which one B2C brands should use
ACS publishes two estimate types.
1-year estimates: 12 months of data, released each September. Only available for geographies with populations above 65,000 — meaning major metros and some counties, but no ZCTAs.
5-year estimates: 60 months of pooled data, released each December. Available for every geography including ZCTAs, tracts, and block groups.
For ZIP-level work, you’re using 5-year estimates. Full stop. The 1-year isn’t available at ZCTA granularity, so the choice is made for you.
The trade-off to know: 5-year data is pooled across five calendar years. The 2024 release covers 2020-2024. Fine for demographics (which move slowly). Wrong tool if you’re tracking a fast shift — post-pandemic migration to the Sunbelt, for example, will be smoothed out in the average.
How B2C founders and marketing/sales operators use ACS data
Five plays, ordered by how much they change what you do next quarter.
1. Find lookalike ZIPs from your top 20% customers (DTC)
Export your Shopify order history. Compute the ZIP code of every customer in your top 20% by AOV or LTV. Pull the ACS profile for each of those ZCTAs — median income, age bracket, household composition, educational attainment.
You’ll find a signature: your top customers concentrate in ZCTAs with, say, $140K+ median income, 32-45 age skew, high graduate-degree share, and majority owner-occupied housing.
Now rank all 33,000 US ZCTAs against that signature. The top 100 lookalike ZCTAs are your priority list for paid acquisition, direct mail, influencer seeding, or geo-targeted meta campaigns. You’ve done in an afternoon what a paid audience-insights tool charges $499/month to approximate.
2. Size your TAM by geography (DTC)
Every founder writes some version of “our TAM is $95B” in a pitch deck. Nobody believes it. ACS lets you build a defensible bottom-up TAM.
Take those 800 lookalike ZCTAs from the previous play. Sum the household counts (from ACS table B11001) — say, 2.4 million households. Multiply by average category spend from the BLS Consumer Expenditure Survey (~$350/year for premium personal care in this income bracket). That’s an $840M addressable TAM.
Now apply realistic penetration: at 0.5% share, that’s a $4.2M revenue ceiling. If your Series A pitch assumes $50M in three years, you have a math problem. If it assumes $8M, you have a fundable business.
3. Prioritize retail expansion markets (specialty coffee)
Cross ACS demographic fit with Census County Business Patterns (retail saturation by NAICS code) to find high-fit, low-competition metros.
A specialty coffee chain looking at expansion filters for metros where ACS shows their target demographic concentration (young, urban, college-educated, $80K+ HHI) and CBP shows a low count of “72232 – Snack and Nonalcoholic Beverage Bars” establishments per capita. Result: three or four metros — Boise, Raleigh, Grand Rapids, Boise — where demand signal is strong and the market isn’t already saturated.
No paid tool needed. Both datasets are free.
4. Position a product by geography (regional bank)
For financial services, ACS is the fastest way to align product marketing with geography.
A regional bank promoting a first-time-homebuyer mortgage program filters ZCTAs where:
- Renter percentage is above 60% (ACS table B25003)
- Median household income has grown year-over-year
- Median age falls between 28-38 (ACS table B01002)
- Educational attainment shows over 40% with a bachelor’s or higher
That’s the launch list. Forty specific ZCTAs where the target customer both exists and is ready to buy. Layer in Community Reinvestment Act (CRA) compliance geographies if you’re a federally regulated bank – many CRA assessment areas overlap.
5. Sharpen ad-platform targeting beyond Meta’s black box
Post-iOS 14, Meta’s interest and behavior targeting has degraded – a well-documented decline in signal quality. ZIP-based custom audiences derived from ACS matching are more stable than “interest = premium beauty” because they’re anchored to actual demographic reality, not Meta’s inference from browsing behavior.
Upload a ZCTA list built from ACS filtering as a custom audience in Meta, Google, TikTok, or CTV platforms. Same list works everywhere. Same list stays valid until your customer signature changes (every 12-24 months) rather than every algorithm update.
This is the play that most directly replaces paid audience tools — and it’s the one operators tend to underuse.
How to actually access ACS data via data.census.gov
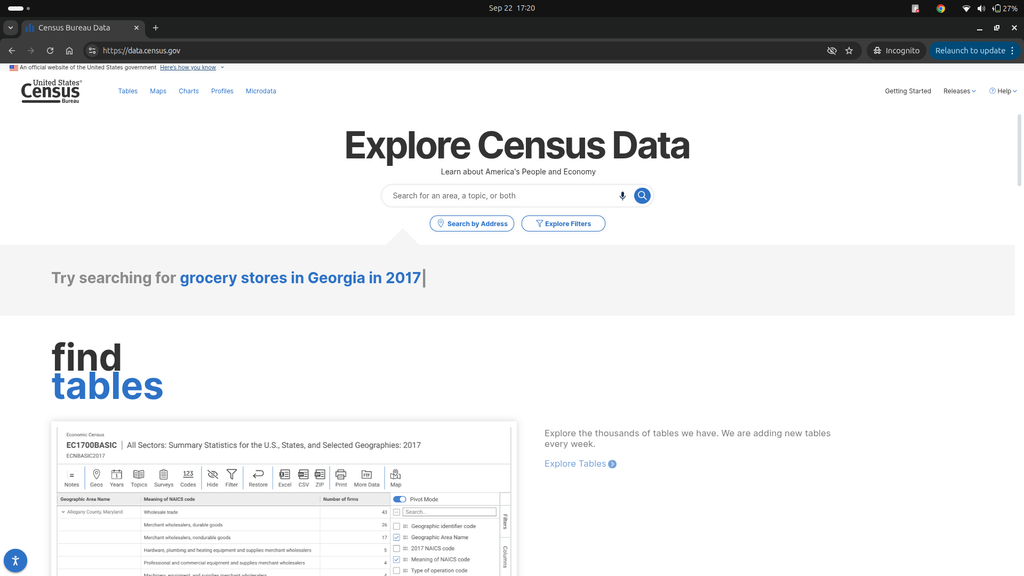
You don’t need to write code. The Census Bureau’s own data portal — data.census.gov — lets you pull any ACS table for any ZCTA in five steps.
Step 1: Go to data.census.gov. You’ll land on a page with a single search bar.
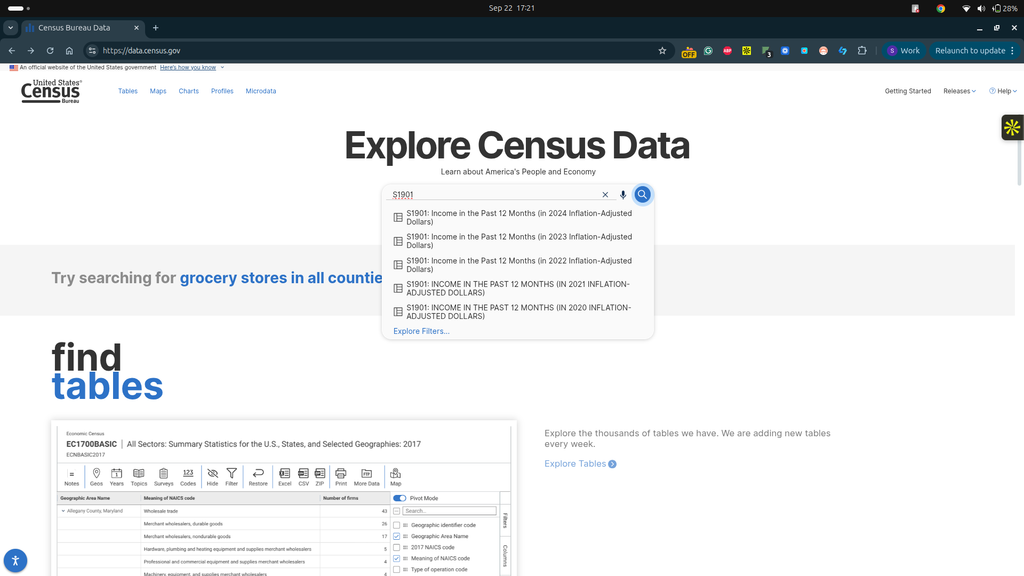
Step 2: Search for the table you need. For income data, type S1901. For age/sex, type B01001. For a full economic profile, type DP03. If you don’t know the code, search a topic keyword like “median household income” and pick from the results.
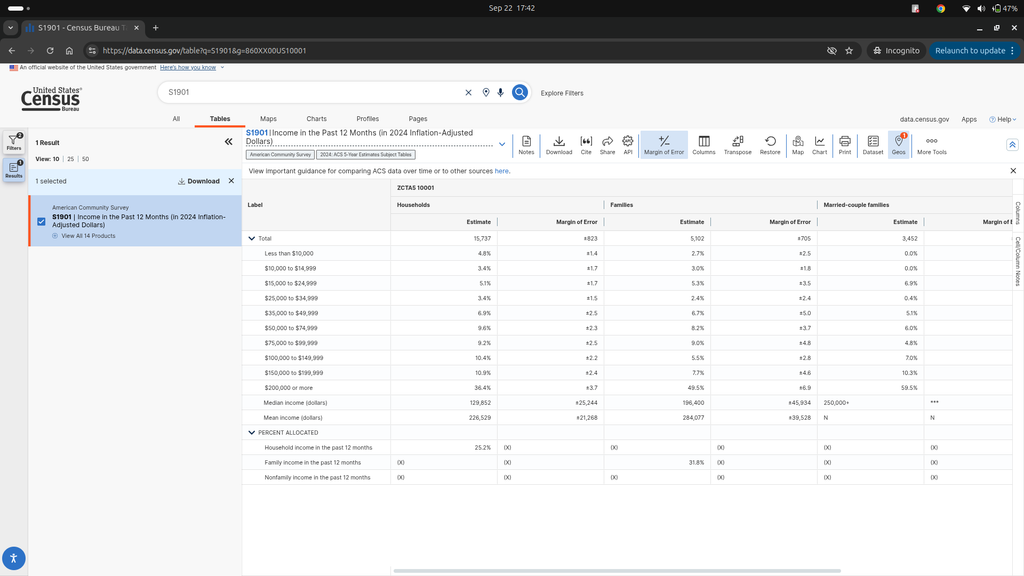
Step 3: On the table page, open the “Geographies” filter. Select “ZIP Code Tabulation Area (ZCTA)” and type the ZCTA(s) you want — one specific code like 10001 for NYC, several at once, or “All ZCTAs within [state]” for state-wide data.
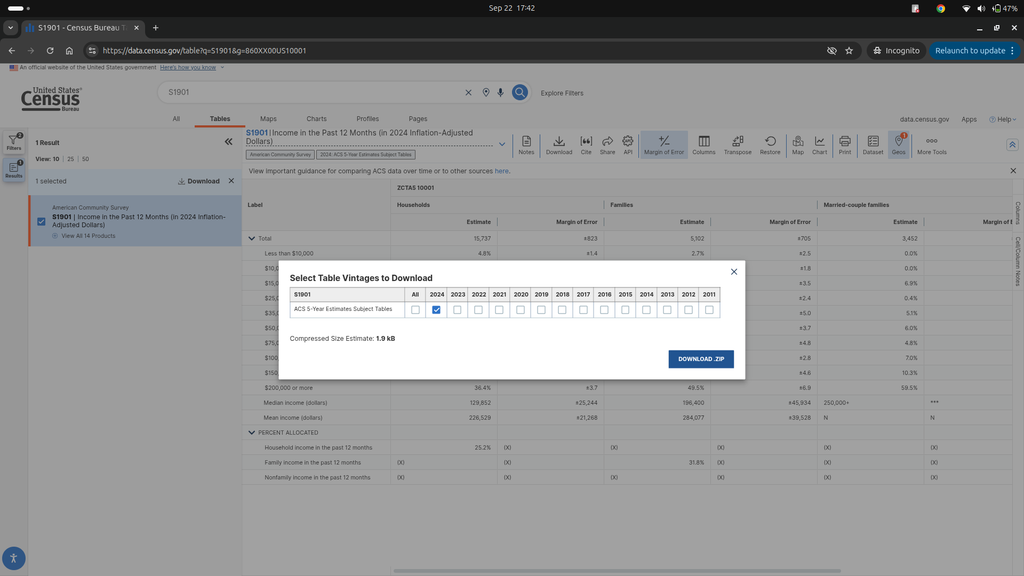
Step 4: Click the download button (top-right). Choose CSV format. You get a spreadsheet-ready file with estimates plus margin-of-error columns.
Five tables every B2C operator should bookmark: DP05 (Demographic overview), DP03 (Economic profile), DP04 (Housing profile), S1901 (Income in past 12 months), B01001 (Sex by age). Between these five, you have 90% of what you need for the use cases above.
One note on the margin-of-error columns: they’re not decorative. At small ZCTAs (under 5,000 population), margins can hit 30%. Always check MOE before making a decision on a small ZCTA — it might be too noisy to act on.
Free ACS vs paid Experian/Claritas — what you lose and gain
The honest comparison, since most B2C founders considering ACS are choosing between it and Experian Mosaic, Claritas PRIZM, or Nielsen Segmentation.
What Experian’s demographic products actually are. Per Experian’s own product documentation, both Mosaic and CAPE (Census Area Projections & Estimates) are built on US Census Bureau data — ACS and decennial Census — blended with Experian’s proprietary consumer, credit, and lifestyle overlays. The Census layer is a stated core input. What you pay Experian for isn’t the demographic data itself. It’s three things stacked on top:
- Credit-file and lifestyle overlays – spending propensity, credit tier, discretionary income signals derived from Experian’s credit bureau file
- Pre-built named segments – Mosaic classifies US households into 19 Groups and 70 Types with human-readable names (“Power Elite,” “Aspirational Fusion”) that make deck-slides easier to build
- Integration convenience – direct pipes to ad platforms, DMPs, and CDPs so you don’t wire up the joins yourself
What ACS gives you they don’t. Full methodology transparency (every calculation is documented in Census guidance). Zero licensing cost. No re-licensing restrictions when you share findings externally. Direct source data that you control end-to-end.
If you have a $10K+/year budget and no analyst to do the joins, paid tools save time. If you have anyone on the team who can filter a CSV or write a SQL join — even a marketing operations person, not a data scientist — free ACS gets you 80% of the insight for zero cost. The remaining 20% is what the paid tools charge for: pre-named segments, credit-file overlays, and one-click ad-platform activation.
For most early- and growth-stage B2C brands, the 80% is enough to make better decisions than the ones currently being made. The paid tools become worthwhile once you’ve hit the ceiling of what demographic filtering alone can tell you.
Limitations of ACS data every operator should know
Four honest caveats.
Lag. The 5-year estimates released in December 2025 cover 2020-2024 — the midpoint is 2022. If you’re tracking a fast demographic shift (a specific metro’s post-COVID migration wave, a gentrifying tract), the pooled average will smooth it out. For stable demographics, this doesn’t matter. For fast-moving ones, layer in IRS SOI migration data.
Margin of error at small geographies. At ZCTAs below 5,000 population — most rural ZCTAs and some suburban ones — margins of error can exceed 30% on specific estimates. Always check the MOE column before making a call on a small ZCTA. If the estimate is $95,000 median income but the MOE is ±$28,000, you don’t actually know if that ZCTA is $67K or $123K median.
ZCTA vs USPS ZIP mismatch. Covered above. Not fatal, but requires the HUD crosswalk to reconcile against operational data.
Demographic, not behavioral. ACS tells you who lives somewhere. It doesn’t tell you what they buy, where they shop, or how they respond to messaging. For behavior, you need CDC PLACES (health behaviors), BLS CEX (category spending), or first-party data. The pillar post covers all of these as complementary layers.
None of these limitations are dealbreakers. They’re just what to know before you rely on the data for a decision.
How current is ACS data?
The freshest ZIP-level ACS data available today is 12-18 months old at midpoint.
1-year estimates are released each September, covering the previous calendar year. But 1-year is only available for geographies above 65,000 population, so not for ZIP codes.
5-year estimates release each December, pooling data collected over the previous five calendar years. This is the ZIP-level release. The December 2025 release covers 2020-2024, with an effective midpoint of mid-2022.
For most B2C decisions — demographic composition, income levels, education mix — this lag is not a problem. Those characteristics move on multi-year timescales. For fast-moving shifts, complement with datasets that release more frequently (BLS employment data, IRS SOI migration).
The point isn’t the dataset. It’s what you do with it.
ACS is the foundation of B2C demographic analysis in the United States. It’s free, it’s federal, it’s been publicly available for two decades, and it powers most of the paid tools operators pay tens of thousands for.
But no ACS query answers a business question on its own. Every use case in this post assumed the same underlying capability: joining ACS ZCTA data to your own operational data — Shopify orders, retail locations, loan applications, subscriber addresses. That join, done cleanly and kept fresh across releases, is where the actual work lives.
That work is what Visual Verb Geo does — pre-joined ACS layers on top of your business data, with the ZCTA/ZIP crosswalk already handled and the segments already built. But you don’t need us to start. Bookmark data.census.gov, download S1901 for the ZIP codes your top 100 customers live in, and see what the median income distribution looks like. The insight-per-hour is high; the barrier is only inertia.
For the full picture of what other public datasets can do besides ACS, read the pillar: The 11 public datasets every US B2C brand should be using.