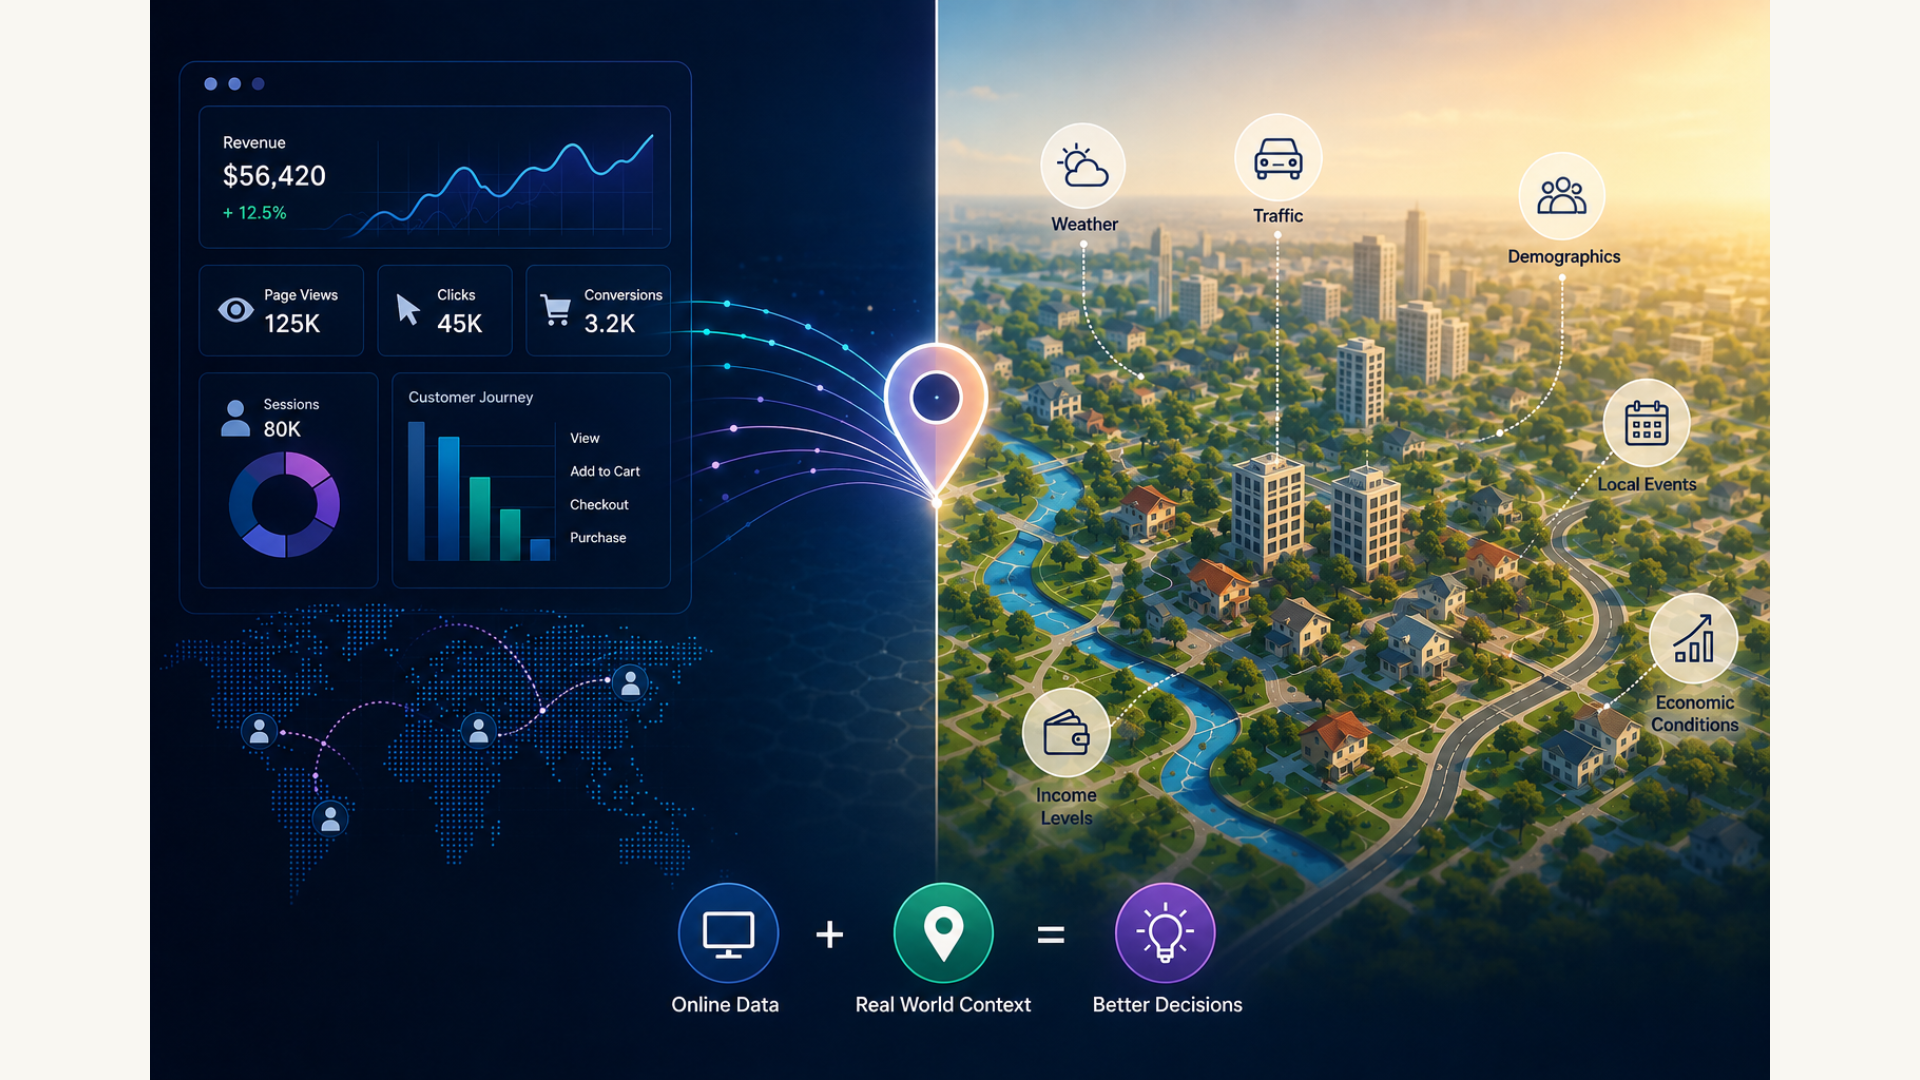
For the past two decades, e-commerce has been built around one belief: everything happens online, and everyone is online.
Most metrics focus on page views, sessions, clicks, impressions, conversions, customer journeys, attribution models, retention curves, and lifetime value. Every interaction a customer has with a website becomes another event in an analytics dashboard.
Over time, we have perfected the whole ads-to-purchase cycle, but we still forget about the most influential variables for every purchase
Geography
Geography is not merely about countries, cities, or places on a map. It is about the relationship between people and the environments in which they live.
Every customer exists somewhere. They wake up in a house. They experience weather, traffic, local events, economic conditions, demographics, infrastructure, and culture.
Even though an e-commerce business is completely digital, the customers live in the real world.
Every online customer eventually has a physical address or, at the very least, a latitude and longitude.
The Digital Blind Spot
Today’s e-commerce companies have almost perfected customer behaviour online; there are hardly any secrets left to be revealed:
The company knows: Which ad was clicked → By whom → And landed on which product → At what time → How long the customer stayed → On which device the customer clicked the ad on → and even know did the customer came back or not → Did the customer open your offer emails or not, etc.
But the business hardly knows anything about the physical world surrounding that customer.
Is it raining today ? Or is there a heat wave ? Is the customer in an affluent neighborhood or a price-sensitive one ? Are they surrounded by young families or retirees ? Do they live in a dense urban apartment or a rural community ? Is there a local festival happening? Or any gaming event happening?
These are not just questions from a curious cat; they are the factors that influence anyone’s purchasing decisions every single day.
Everything That Happens Before the Click
Every buying decision is influenced by context.
Downtown or Suburb: A parent living in a suburb shops differently from a parent in Manhattan.
Disposable income: People in neighborhoods with higher disposable income evaluate products differently from customers in areas where affordability dominates purchasing decisions.
Median Income: Directly related to disposable income and significantly impacts a company’s pricing.
Local Weather & Climatic conditions: Someone living in Phoenix experiences summer differently from someone living in Seattle. The weather influences clothing, food, transportation, outdoor activities, and even mood.
Population density: How many people live in a given area shapes what customers expect from delivery. It decides whether same-day delivery is a promise or a fantasy.
School holidays & local events: When schools close, or the town hosts a big game, demand for products spikes and shifts in ways that are completely different from national forecasts.
Culture: Regional tastes, festivals, food habits & other facets of culture impact what is sold in those geographies .
These variables are invisible in your dashboard, but they are not invisible in the world. The question is whether you’re willing to look.
What’s Missing From Your Customer Data?
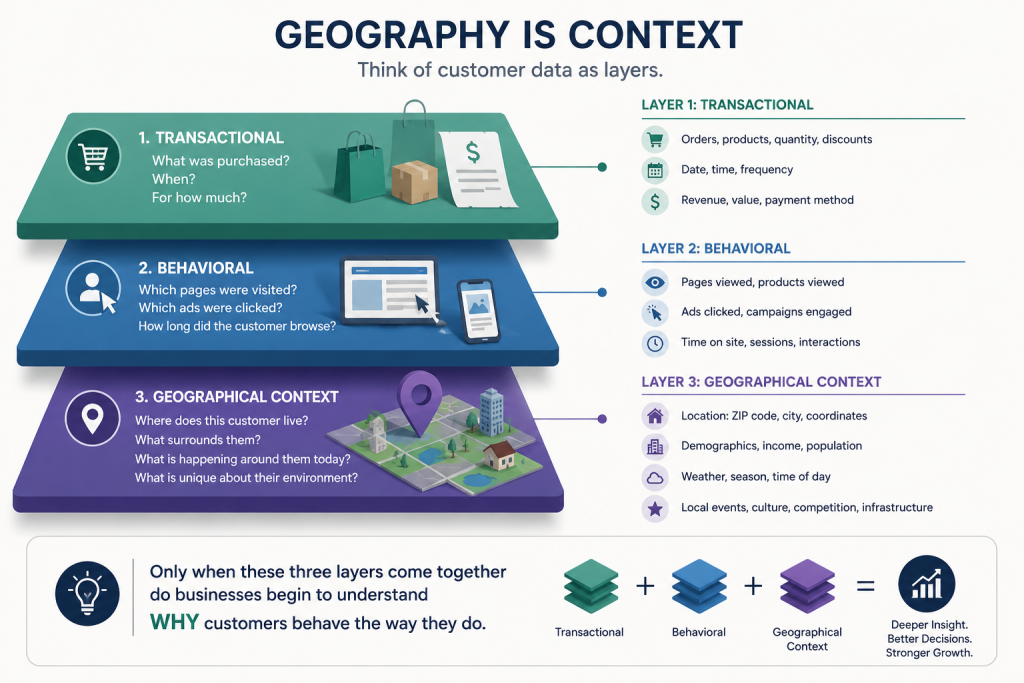
We think of customer data as stacked in three layers.
Transactional: What was purchased → when it was purchased and for how much? Mostly focusing on the transaction that happened.
Behavioral: This mainly focuses on consumer behaviour on the internet. The pages viewed & clicked, products viewed, time spent on the pages and website etc by the consumer.
So the first two layers focused on what customers bought and how they browsed and this is what every analytics stack was built to capture. They’re clean, they’re event-based, they live inside your product.
Then comes the third layer
This layer lives in the real world (IRL). The main focus is on the ZIP codes, weather patterns, local incomes, festivals, competitor stores down the street. This data doesn’t show up in any dashboard by default; it has to be brought in.
No pixel fires when it rains in Seattle. No event is logged when the local game’s final starts. That’s why this layer stays invisible.
Only when all three layers come together do businesses begin to understand why customers behave the way they do.
From Data to Intelligence
ZIP 07078 (Short Hills, NJ). ZIP 11211 (Williamsburg, Brooklyn). Same monthly revenue for your brand. Your dashboard treats them as equals.
You’d spend the same on ads in both. You’d forecast them the same way. You’d probably run similar offers and give the same rewards to the same account manager.
| 07078 — Short Hills, NJ | 11211 — Williamsburg, Brooklyn | |
| Monthly revenue made by the brand | $50,453 | $50,231 |
| Median household income | ~$250k+ | ~$110k |
| Your market penetration | 2% | 34% |
| Competing D2C brands nearby | 3 | 40+ |
| Digital reachability | Low (older, affluent, low social media time) | Very high (young, urban, digitally native) |
| Illustrative figures for a hypothetical apparel brand” |
Same number. Opposite stories.
ZIP Code – 07078: untapped. You own 2% of a wealthy, uncrowded market. Double the spend, double the revenue.
ZIP Code – 11211: Saturated. You own 34% of a crowded, ad-fatigued market. Double the spend, same customers.
Without the geographic layer, both markets look like top performers, and both get the same investment. With it, one is your next growth engine and the other is a plateau dressed up as a win.
The Future of Commerce is Location-Aware
For decades, commerce has been driven by transactional intelligence – understanding what customers bought, when they bought it, and how much they spent.
With the rise of digital commerce, a second layer emerged: behavioral intelligence. Businesses gained unprecedented visibility into how customers discovered products, which channels influenced them, how they navigated websites, and the digital journey that ultimately led to a purchase.
Over time, companies have become exceptionally good at collecting and acting on these signals. As a result, competition has intensified.
In today’s market, understanding what customers do is no longer enough. Businesses must understand why they make those decisions.
That “why” often lies beyond the digital world.
Customers do not make purchasing decisions in isolation. They are influenced by the environments in which they live – their neighborhood, local economy, weather, demographics, infrastructure, culture, and countless other geographic factors that shape their daily lives.
By combining internal transactional and behavioral data with external geographic context, businesses can begin to answer questions that traditional analytics cannot:
- Why did sales grow in one region but decline in another?
- Why did customers in one neighborhood respond to a campaign while others did not?
- Why do certain markets consistently outperform others?
- Where is the next high-potential market for expansion?
The next competitive advantage in commerce will not come from collecting more customer data – it will come from understanding the context in which customer decisions are made. Geography provides that context.
Geography shapes the environment in which purchasing decisions are made.
Just to reiterate, many people associate geography with maps. Maps are simply a visualization. Geography is about understanding the environment in which people make decisions.
Every purchase has a location. Every customer has a neighborhood. Every business operates within markets that have unique characteristics. Ignoring geography means ignoring one of the most important dimensions of customer behavior.
The Building Blocks of Geo Intelligence
Customers do not make purchasing decisions in isolation. Every decision is influenced by the environment in which they live, the people around them, the economic conditions they experience, and the markets in which they participate.
Geo Intelligence is the discipline of understanding this context.
To simplify this complexity, we introduce the 4Ps of Geo Intelligence – a framework that describes the four dimensions influencing every location and every customer.
These four dimensions work together to transform a location from a simple point on a map into a comprehensive source of business intelligence.
P1 : Place
Where are your customers?
With this we are trying to understand the question, where does my customer live exactly, the physical charactersistics of the place.
Place represents the physical characteristics of a location.
The environment surrounding customers influences accessibility, mobility, logistics, climate, and ultimately purchasing behavior.
A densely populated urban neighborhood behaves differently from a rural town. A coastal city experiences different demand patterns than an inland region.
Weather, infrastructure, transportation, and land use all contribute to how people live and consume products.
Understanding Place helps businesses answer questions such as:
- How accessible is this market?
- Can we serve this region efficiently?
- How does climate influence product demand?
- Which physical characteristics affect customer behavior?
Below are the datasets that turn these questions into answers:
1. Natural Environment
Describes the natural characteristics of a location.
- Terrain & elevation, Climate zones, Weather (current & seasonal), Natural risk zones, Land cover & green cover
2. Built Environment
Describes how a location has been developed.
- Physical infrastructure, Land use, Urban / Peri-urban / Rural classification, Night-light & built-up growth
3. Accessibility & Connectivity
Measures how easily people and goods can move.
- Road & transport infrastructure, Public transit access, Travel time, Catchment areas
4. Geographic Boundaries & Landmarks
Defines where a location exists and what surrounds it.
- Administrative boundaries, Points of Interest (POIs), Business districts, Educational & healthcare institutions
P2 : People
Who lives there?
In this , understand the composition of the people in a given geography. Every market is ultimately a collection of people.
Population characteristics influence purchasing power, product preferences, communication strategies, and long-term demand. Age distribution, family structures, education, migration, language, and community composition all contribute to how customers make decisions.
Understanding People helps businesses answer questions such as:
- Is this our target customer?
- What types of households dominate this market?
- How is this population changing?
- What demographic trends will shape future demand?
Below are the datasets that turn these questions into answers
1. Population Profile
Who lives here?
- Total population, Population density, Age distribution, Gender ratio
2. Households & Communities
How are people organized?
- Household size, Household composition, Marital status, Community composition
3. Education & Workforce
How educated and skilled is the population?
- Education attainment, Literacy rate, Occupation type, Workforce participation
4. Population Dynamics
How is the population changing?
- Migration patterns, Primary language, Housing quality, Population growth
P3 : Prosperity ( Economy )
Prosperity – We are trying to answer the question ” What can customers afford ? “
Prosperity represents the economic strength and purchasing power of a market.
Historical sales often reflect where a business has operated, not necessarily where the greatest opportunities exist.
Economic indicators provide a forward-looking view of market potential by revealing income levels, employment, spending capacity, commercial development, and financial inclusion.
Understanding Prosperity helps businesses answer questions such as:
- Which markets have the greatest purchasing power?
- Where is disposable income growing?
- Which regions deserve additional investment?
- Where is future demand likely to emerge?
1. Income & Wealth
How much purchasing power exists?
- Income level, Income distribution, Asset ownership, Vehicle ownership
2. Employment & Industry
What drives the local economy?
- Employment & unemployment, Workforce by sector, Major industries, New business registrations
3. Consumer Economy
How do people spend money?
- Consumer spending by category, Retail & commercial density, Digital & payment penetration, Credit penetration
4. Economic Growth
How attractive is this market?
- GDP data of the region , Cost of living, Property & rental prices , Economic growth indicators
P4: Pulse (Market)
What is happening there today?
Markets are constantly changing.
Competitors launch promotions. Consumers respond to local events. Search demand fluctuates. Logistics improve. Businesses open and close. Consumer sentiment evolves.
Pulse captures these dynamic signals and helps businesses understand not just the current state of a market, but where it is heading.
Understanding Pulse helps businesses answer questions such as:
- How competitive is this market?
- What external factors are influencing demand?
- Which markets are gaining momentum?
- Where should we expand next?
1. Competition
Who else is competing?
- Competitor locations, Competitor pricing, Competitor promotions, Business openings & closures
2. Customer Demand
What are customers looking for?
- Search demand, Category seasonality, Consumer sentiment, Social & review activity
3. Market Activity
What is happening in this market?
- Footfall, Mobility flows, Events calendar, Regulatory & policy changes
4. Commerce & Operations
How efficiently can business be conducted?
- E-commerce order density, Logistics & serviceability, Return / RTO rates, Advertising inventory & media costs
Putting the 4Ps Together
| P | Core Question | Four Building Blocks |
| Place | Where is the customer? | Natural Environment • Built Environment • Accessibility • Geographic Boundaries |
| People | Who are the customers? | Population Profile • Households • Education & Workforce • Population Dynamics |
| Prosperity | What is their purchasing power? | Income & Wealth • Employment • Consumer Economy • Economic Growth |
| Pulse | What is happening in the market? | Competition • Customer Demand • Market Activity • Commerce & Operations |
Bringing the 4Ps Together
Each of the four Ps explains one aspect of a location.
- Place explains the physical environment.
- People explains who lives there.
- Prosperity explains purchasing power.
- Pulse explains what is happening in the market today.
Individually, these dimensions provide useful insights. Together, they provide context.
When combined with a company’s own transactional and behavioral data, the 4Ps transform traditional reporting into Geo Intelligence – helping businesses understand not only what happened, but why it happened, and ultimately where they should grow next.
Geo Intelligence is not about adding more data. It is about adding context to every business decision.